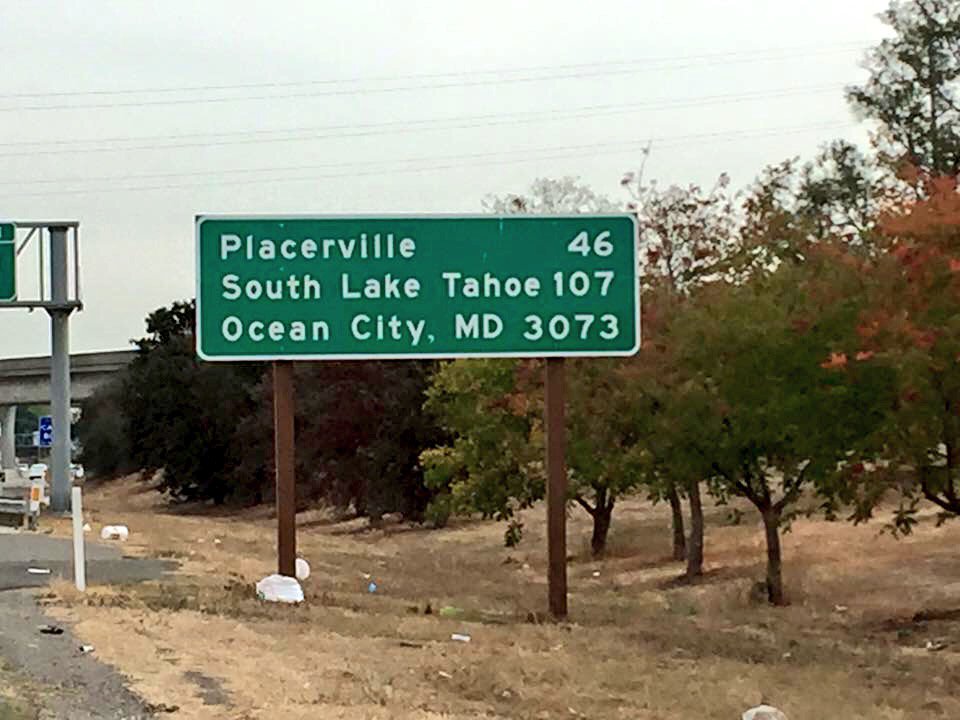
- "@Yummymath: Is there a math question or math task here? #mtbos #mahchat #elemchat #elemmathchat " @jensilvermath
- .@parkermathed @Yummymath Graph circles centered at those cities with the distances as radii & you can locate the sign. #mtbos #mathchat
- @parkermathed @Yummymath Practical issues: road dist or crow's flight? Curvature of Earth? Better w closer cities!
- Back in 2012, after Hurricane Sandy, I created a lesson for students to discover the distance formula from using the Pythagorean Theorem on the coordinate plane. It was a successful lesson by #MTBoS standards; low floor, high ceiling. Students were given a map with axes but no markings for intervals. The origin was Bel Air, MD where the school is and there were several cities marked on the map, including Atlantic City where Hurricane Sandy made landfall.
- The first question asked students to decide on coordinates for the cities listed. The given information had the distance from Bel Air to Atlantic City (90 miles East and 20 miles South), but with no markings on the map, students were initially at a loss.


- Many students started with Atlantic City as coordinates of (90, 20), some went with (90, -20), but then struggled to get the other cities. Some went right to a ruler but measured the direct distance from Bel Air to Atlantic City. There was A LOT of productive struggle as groups wrestled with the seemingly simple task of creating coordinates. Eventually, most groups got to the idea of measuring to make a coordinate plane. This is where things got interesting. Some of the groups decided to make the coordinates in the map distance. For example Atlantic City was (4.5, -1) since that was the distance on the map in centimeters. Other groups stuck with the actual distances of (90, -20). Both groups had to deal with converting the distances throughout the problem, though in different ways.
 Jen Silverman


The follow up questions involved deciding if certain cities felt hurricane force winds or just tropical storm force winds. This is where students were to discover/use the distance formula to determine if the cities were within the range to feel certain winds. Students that used the map distances for coordinates had to account for that in their checking process. It led to some great discussions about units.
At the bottom of the page, students were asked to create a general statement about what it takes for a city to have felt hurricane force winds. I had to do some clarifying and next time would ask students to make a rule for a city with coordinates of (x,y). This would help clarify the expectation that I want a symbolic statement comparing (c,y) to (90, -20) and the required 80 mile mark. Students that were able to handle this extra task discussed the use of square roots, inequalities, and variable coordinates to represent an infinite number of solutions.
On the map, students were asked to color the area that was affected by hurricane winds and the area affected by tropical storm force winds. With some prompting, students were able to draw the required circular sections. We then connected the visual to the inequality for a rich discussion. Overall, one of my more successful lessons because of the depth of the task, the ability to conceptualize their own coordinates (either in miles or cm) and the representation of a "real-world" problem through instances, inequalities and graphs.
No comments:
Post a Comment